Information radiators in the office are great, especially for development teams. Broadcasting the state of CI builds, automated tests and environments ensures that everyone is aware of any breakages, and that these breakages are less likely to be ignored. Attach a Raspberry Pi to large TV or monitor, and you’ve got a cheap and easy way to set this up anywhere in the office.
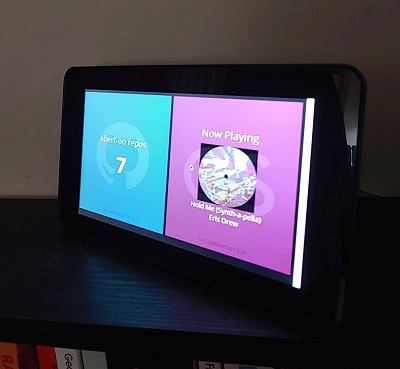
Here I explore how this idea could be applied at home. Looking at what’s involved in building and coding an information radiator at home, displaying at-a-glance details of daily life.
The Hardware
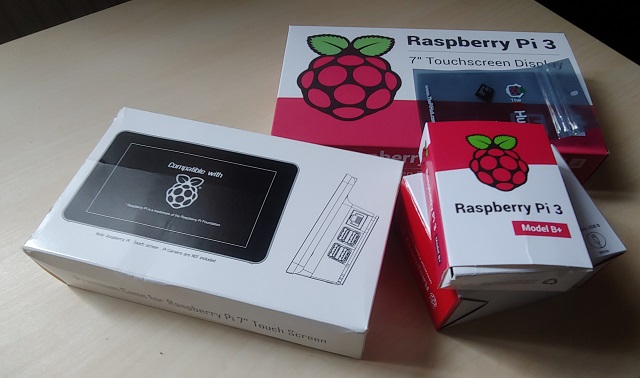
The hardware used is all pretty standard. On the computing side, a Model B+ Raspberry Pi was chosen to ensure enough horsepower to render the dashboard as smoothly as possible. Previous experience had shown previous Raspberry Pi models to often stutter or freeze when displaying complicated dashboards that cycle between multiple pages of widgets. For the display, the official 7” touchscreen display will be used. I wanted something that could be left on all the time without drawing too much power, or taking my current TVs or monitors out of action. Being touchscreen it also removes the need to keep a keyboard and mouse handy. A display frame is then used to combine the set-up in to one, simple looking, easy to move unit. Finally an official power supply and SD card, preloaded with the Debian-based Raspbian OS, complete the set. The whole lot came to £125, with the touchscreen display accounting for most of this.
The Build
Now for the fun bit, putting it all together.
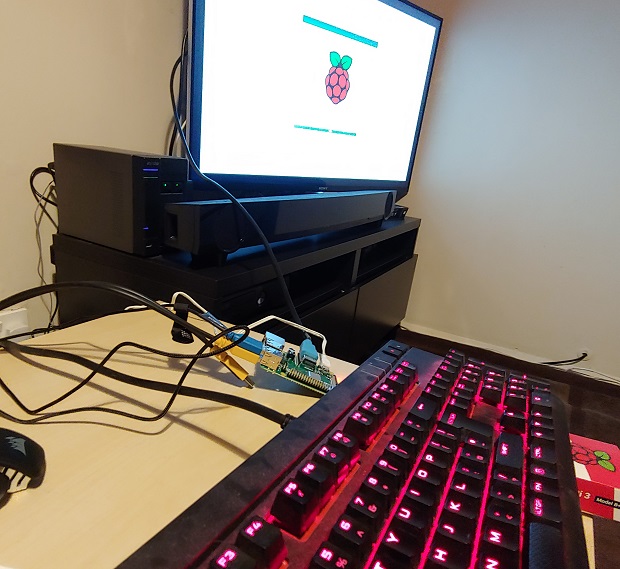
First to get the Raspberry Pi up and running. Temporarily borrowing a HDMI socket on my TV and a spare keyboard and mouse, I followed the official set-up guide and this was all pretty straightforward. Insert the SD card, keyboard, mouse and HDMI cable. Connect up the power and the Pi starts up. Once booted, follow the instructions to install the Raspbian OS and wait…
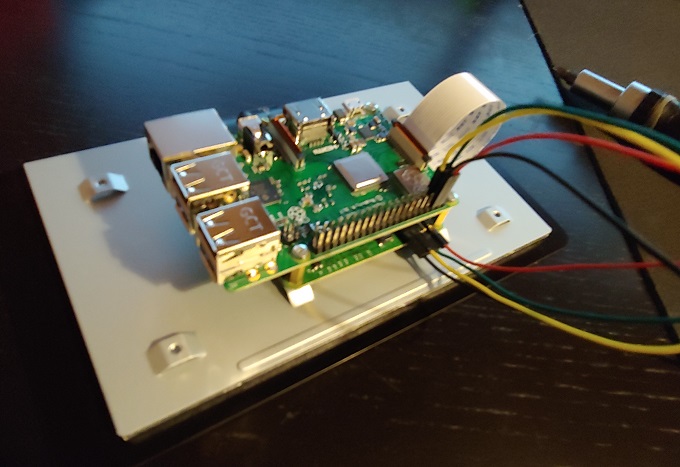
Once it’s finished installing and booted in to Raspbian, it’s time to shut it down and look at attaching the screen. This proved to be a bit more fiddly. There’s a ribbon cable for the display that has to connected on both the screen’s board and the Pi. On both ends this requires wiggling a very fragile feeling cable into a slot and then clamping it down with the tiny plastic bars on each socket. This took a couple of attempts to get right, with the first attempt resulting in a blank screen and a very worrying few minutes!
Once the fiddly ribbon is in place, the jumper wires for the power can be inserted in to screen board. While the relevant pins are labelled, the cables themselves aren’t. It shouldn’t really matter which cable is used for what, but a quick google instantly brought up lots of helpful guides on how they should be used. Now to screw the Pi to the screen with the supplied screws and then connect all the cables up to the relevant pins and sockets on the Pi. Again this may require guidance as the pins on the Pi aren’t labelled.
The whole unit now slides rather snugly in to the case. Be sure to line up all the sockets before screwing the case on to the unit though.
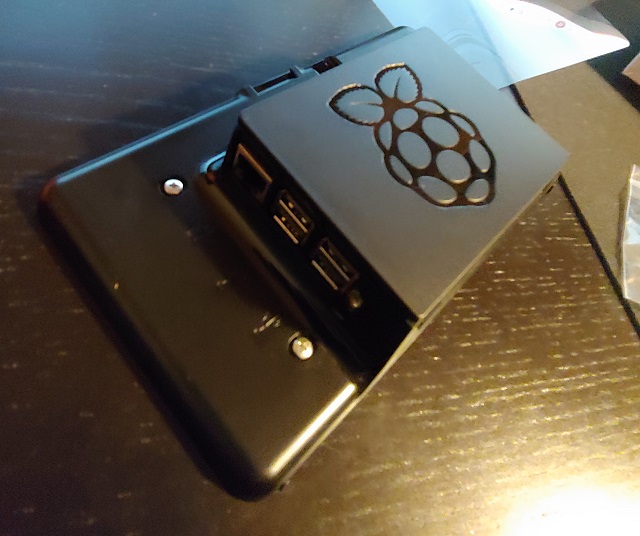
Plug the power supply in to the power socket for the screen and the whole unit should power up. Now, while we’ve still got that spare keyboard and mouse lying around, there’s a few tweaks we need to make for the screen to be usable.
First make sure the Pi is connected to the internet over WiFi or Ethernet so that we can install a few things. Firstly, for some reason the screen starts upside down. To fix this we’ll need to update the boot config. To open the config file use sudo nano /boot/config.txt and then add the following line to the bottom of the file: lcd_rotate=2. Now let’s also install a on-screen keyboard for typing: apt-get install matchbox-keyboard. We’ll also want to turn off the screensaver so that the dashboard can be displayed 24⁄7. We can do this by installing the x-screensaver tool using apt-get install x-screensaver. Once installed we can turn select the “disable screensaver” option in Menu -> Preferences -> Screensaver. Restart the Pi everything should be ready for us to start turning it in to an information radiator.
One extra setting you can apply to make latter development of the dashboards easier is to enable SSH. That way you can access the Pi from another computer with a bigger display, keyboard and mouse. To enable this go to Menu -> Preferences -> Raspberry Pi Configuration -> Interfaces. Once enabled you should be able to access the Pi from another computer using ssh pi@<ip_address>.

The Software
The idea for the software side of the dashboard was to use the Ruby-based Smashing dashboards with which I am quite familiar. A simple looking solution that would also allow multiple pages of widgets to be cycled through, a must with the small resolution of the display.
The installation of this is described on the Smashing github page and with Ruby already installed by default on Raspbian, there was only 1 extra step needed. Before installing the “smashing” gem, we need to make sure that we have the “ruby-dev” package installed using apt-get install ruby-dev.
Out of the Box Widgets
There are also sorts of additional widgets available for Smashing. I made use of the following:
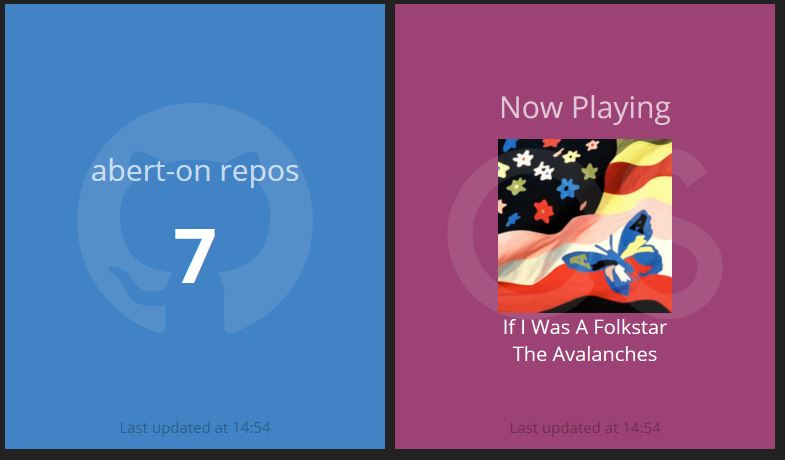
- LastFM for showing my last played or currently playing track. I also added another API call to this job and a new widget for displaying my weekly top tracks.
- National Rail Live Data for showing the local train times.
- GitHub User Info for showing my GitHub stats.
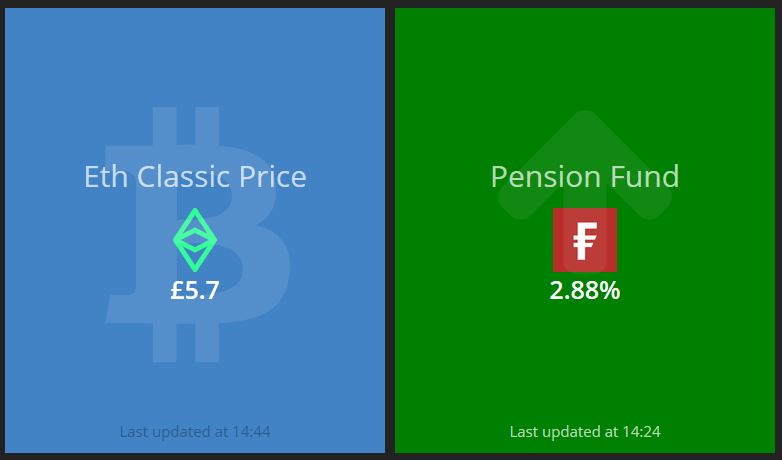
- GDAX Spot Rate for live crypto-currency prices, adapted to also show Ethereum Classic prices.
Custom
The beauty of Smashing, is of course the ability to easily add custom widgets. Using custom Ruby jobs to collect data and send it in events to the dashboard. I added the following custom widgets to my dashboard:
- A Pension Fund Price widget that skims the yearly performance of my Fidelity pension fund from a Financial Times website.
- Habit and finance tracking widgets that pull data from private Google sheets.
- Google Analytics for real-time visitor information for this site.
Here’s a quick look at how they were built…
Pension Fund Price
This widget is super simple in Ruby. Using the Nokogiri gem to parse a HTML page:
require 'open-uri'
require 'nokogiri'

SCHEDULER.every '60m', :first_in => 0 , allow_overlapping: false do
    document = Nokogiri::HTML.parse(open('https://markets.ft.com/data/funds/tearsheet/summary?s=gb00bz0d7p77:gbx'))
    yearly_change = document.xpath("/html/body/div[3]/div[2]/section[1]/div/div/div[1]/div[2]/ul/li[3]/span[2]/span")

    send_event('pension_year', { value: yearly_change.text} )
end
The yearly change data is then displayed on a widget that will change colour depending on whether the price has gone up or down:
class Dashing.PensionFund extends Dashing.Widget
  onData: (data) ->
    if parseFloat(data.value) < 0
      $(@node).find('div.fund-down').show()
      $(@node).find('div.fund-up').hide()
      $(@node).css("background-color", "red")
    else
      $(@node).find('div.fund-down').hide()
      $(@node).find('div.fund-up').show()
      $(@node).css("background-color", "green")
$(@node).css("background-color", "#12b0c5")
<div class="fund-up">
    <h1 class="title" data-bind="title"></h1>
    <img src="https://www.fidelity.co.uk/static_cms/fil_site_assets/images/f-logo-mobile.png" class="logo" style="height: 64px; width: 64px;"></img>
    <h3 data-bind="value" class="price value"></h3>
    <p class="updated-at" data-bind="updatedAtMessage"></p>
    <i class="fa fa-arrow-up icon-background"></i>
</div>

<div class="fund-down">
    <h1 class="title" data-bind="title"></h1>
    <img src="https://www.fidelity.co.uk/static_cms/fil_site_assets/images/f-logo-mobile.png" class="logo" style="height: 64px; width: 64px;"></img>
    <h3 data-bind="value" class="price value"></h3>
    <p class="updated-at" data-bind="updatedAtMessage"></p>
    <i class="fa fa-arrow-down icon-background"></i>
</div>
Google Sheets and Analytics data
These widget are a bit more tricky. While there are existing widgets for both Sheets and Analytics, they are both quite old. In fact the Ruby gems for the Google APIs have moved on so far that code provided no longer compiles. Below is my attempt to use the latest APIs based on Google’s quickstart guide for Ruby.
The Ruby job to fetch cell data from a Google Sheets:
require 'google/apis/sheets_v4'
require 'googleauth'
require 'googleauth/stores/file_token_store'
require 'fileutils'

OOB_URI = 'urn:ietf:wg:oauth:2.0:oob'.freeze
APPLICATION_NAME = 'Google Sheets API Ruby Quickstart'.freeze
CREDENTIALS_PATH = 'jobs/credentials.json'.freeze
TOKEN_PATH = 'token.yaml'.freeze
SCOPE = Google::Apis::SheetsV4::AUTH_SPREADSHEETS_READONLY

SCHEDULER.every '60m', :first_in => 0 do |job|
    # Initialize the API
    service = Google::Apis::SheetsV4::SheetsService.new
    service.client_options.application_name = APPLICATION_NAME
    service.authorization = authorize

    wellness = getCellValue(service, '<SHEETID>', 'Sheet1!B23:B24')
    money = getCellValue(service, '<SHEETID>', "'2018-19'!B28:B29")

    send_event('sheets_wellness', { value: wellness.to_f })
    send_event('sheets_money', { value: money.to_f })


end

def getCellValue(service, spreadsheet_id, range)
    response = service.get_spreadsheet_values(spreadsheet_id, range)

    puts 'No data found.' if response.values.empty?

    cell = response.values[0][0]
    #puts "#{cell}"

    return cell
end

##
# Ensure valid credentials, either by restoring from the saved credentials
# files or intitiating an OAuth2 authorization. If authorization is required,
# the user's default browser will be launched to approve the request.
def authorize
    client_id = Google::Auth::ClientId.from_file(CREDENTIALS_PATH)
    token_store = Google::Auth::Stores::FileTokenStore.new(file: TOKEN_PATH)
    authorizer = Google::Auth::UserAuthorizer.new(client_id, SCOPE, token_store)
    user_id = 'default'
    credentials = authorizer.get_credentials(user_id)
    if credentials.nil?
      url = authorizer.get_authorization_url(base_url: OOB_URI)
      puts 'Open the following URL in the browser and enter the ' \
           "resulting code after authorization:\n" + url
      code = gets
      credentials = authorizer.get_and_store_credentials_from_code(
        user_id: user_id, code: code, base_url: OOB_URI
      )
    end
    credentials
end
The Analytics jobs is very similar, but accesses data via the Google::Apis::AnalyticsV3 API. These jobs are then combined with a graph widget (supplied as a default) for the Analytics and a widget very similar to the pension fund one described above for the Sheets data.
Summary
So there we have it. An information radiator at home. There’s still a few changes I want to make to the widgets to make the data more useful, but I see this being a continuous effort to make sure the information is relevant to whatever is going on in my life. Time will tell how stable the Pi and Ruby jobs remain when running 24⁄7. I’d also like to put in place some kind of continuous integration and deployment to keep the dashboard up-to-date with any changes I push to it’s Git repository. Watch this space.
Share on: